LiveAtlas
These interactive maps show Early Development Instrument (EDI) results, socio-economic data and information on community resources for communities and subcommunities in Alberta. The maps also show administrative boundaries for the province. Please note that LiveAtlas works best in Chrome, Firefox and Safari.
The maps have been organized into three categories: Boundary maps, Data maps and Multi-data maps. Instructions on How to use the maps can be found on the How to use link under each map on this page. Or in the LiveAtlas User Guide.
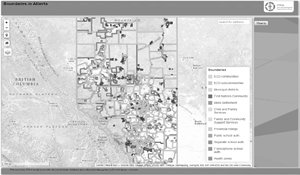
Boundary maps
Show community and subcommunity boundaries and other administrative boundaries for Alberta.
|
|
|
||
Boundaries map (multi-layer) |
|
|
||
Shows two or more boundaries at a time |
||||
|
Data maps
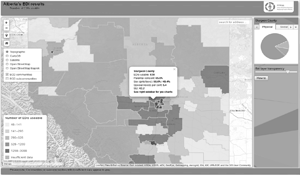
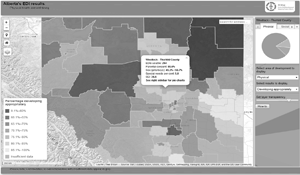
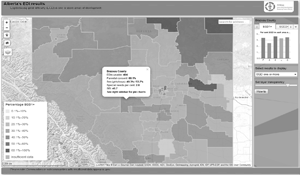
Show one type of data: Early Development Instrument (EDI), socio-economic index (SEI) and community resources. Data results are provided at the community and subcommunity level.
 |
 |
 |
||
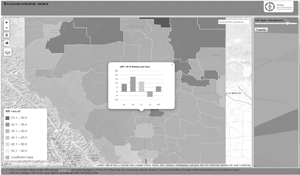
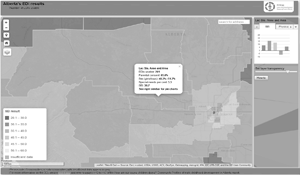
EDI summaries |
|
In-depth EDI by area of development |
In-depth EDI by category |
|
|
|
|
||
|
|
|
||
Socio-economic index (SEI) |
|
|
||
|
||||
|
Multi-data maps
Maps display two types of data at the same time to allow for easier comparison between different data sets.
 |
 |
 |
||
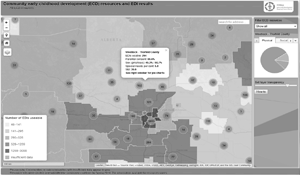
EDI results and community resources |
|
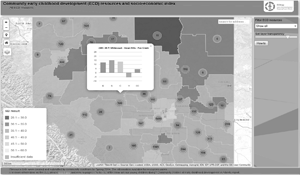
Socio-economic index (SEI) and community resources |
EDI results and socio-economic index (SEI) |